Why Equity?
If you are sitting on the fence with equity investments, here are three charts that can help clear it up for you.
The first one shows how historically equity has created wealth, provided you remain invested. The chart only focuses on index and benchmark returns, however, if you use managed portfolios to invest where the fund manager track record is consistent, you stand a chance for even better returns in the long run. Moreover, long term capital gains on equity are better than many other assets. Lastly, investing in equity has never been so flexible, accessible and transparent thanks to the growth of mutual funds.
Here is the first chart that should clear up your doubts about Why Equity?
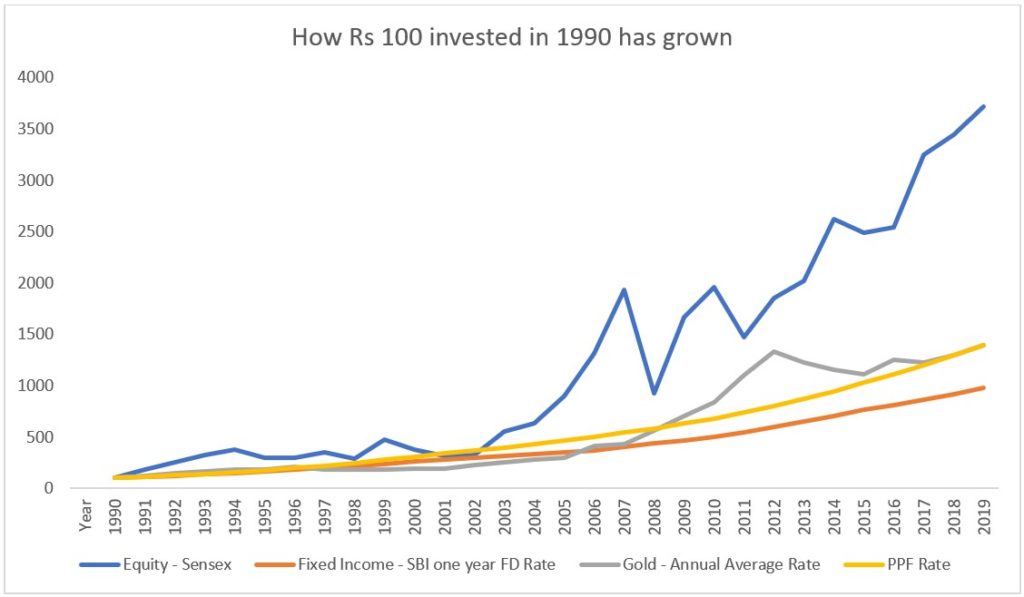
This chart is a clear indicator of the kind of wealth creation that equity can deliver, but only in the long term. In the short term, ie less than 7-10 years you can even lose half your capital or more.
Why long term?
Once again historical data shows that if you hold on to your equity investments for at least 10 years there is practically no chance that you will lose money and say you invested only in the index, Sensex, there is an 80% chance you will make 10% plus annualised returns. This is a very good record of wealth creation. However, the key is that you need to be able to hold tight for a long time.
The longer you hold on the better it is.
| Number of years | Chance of negative return | Chance of return greater than 10% |
| 7 | 7% | 62% |
| 10 | 1% | 80% |
| 15 | 0% | 94% |
| 20 | 0% | 91% |
Source: Internal Research
Why start early?
This question is partly answered in the data above. The earlier you start, chances are the longer you will remain invested, hence, the more stable your chances of wealth creation. Secondly, the earlier you start the lesser you will have to invest to get to your target return. If you flip that around, it means that the sooner you will achieve your target return for the same amount of investmentAn investment is made to give you a return. You make an investment if you use your money to buy either physical assets like property or financial assets like bonds and equity with an aim to receive income or gains... More.
Sample this: say you want to achieve a target return of Rs 50 lakhs at the end of 5 years. Let’s assume you invest in actively managed equity mutual funds with an expected return of 12% annualised over 5 years. With these assumptions you will need to invest Rs 62000 every month for 5 years to get a corpus of around Rs 50 lakh at the end of the period. Say – you have 10 years to reach this target, then you need to invest Rs 22000 every month and if you extend that to 20 years, you need to invest Rs 5050 every month to get Rs 50 lakh at the end. Hence, the sooner you start the lesser you need to invest regularly and that reduces the immediate strain on your money.
How much will you have to invest every month at an assumed 12% annualised return to reach a target of Rs 10 lakh
| Number of years to target return | Regular monthly investmentAn investment is made to give you a return. You make an investment if you use your money to buy either physical assets like property or financial assets like bonds and equity with an aim to receive income or gains... More |
| 5 | 12250 |
| 6 | 9550 |
| 7 | 7700 |
| 8 | 6300 |
| 9 | 5200 |
| 10 | 4400 |
Source: Internal Research
Hopefully, once you have seen these charts – I won’t have to use any more words to convince you to start investing in equity now!